Introduction to Quarto
2023-10-31
Quarto (and R Markdown) workflow


Change your mental model
No more copy-paste, no more manually rebuilding analyses from disparate components, no more dread when the data is updated and you need to run an analysis.
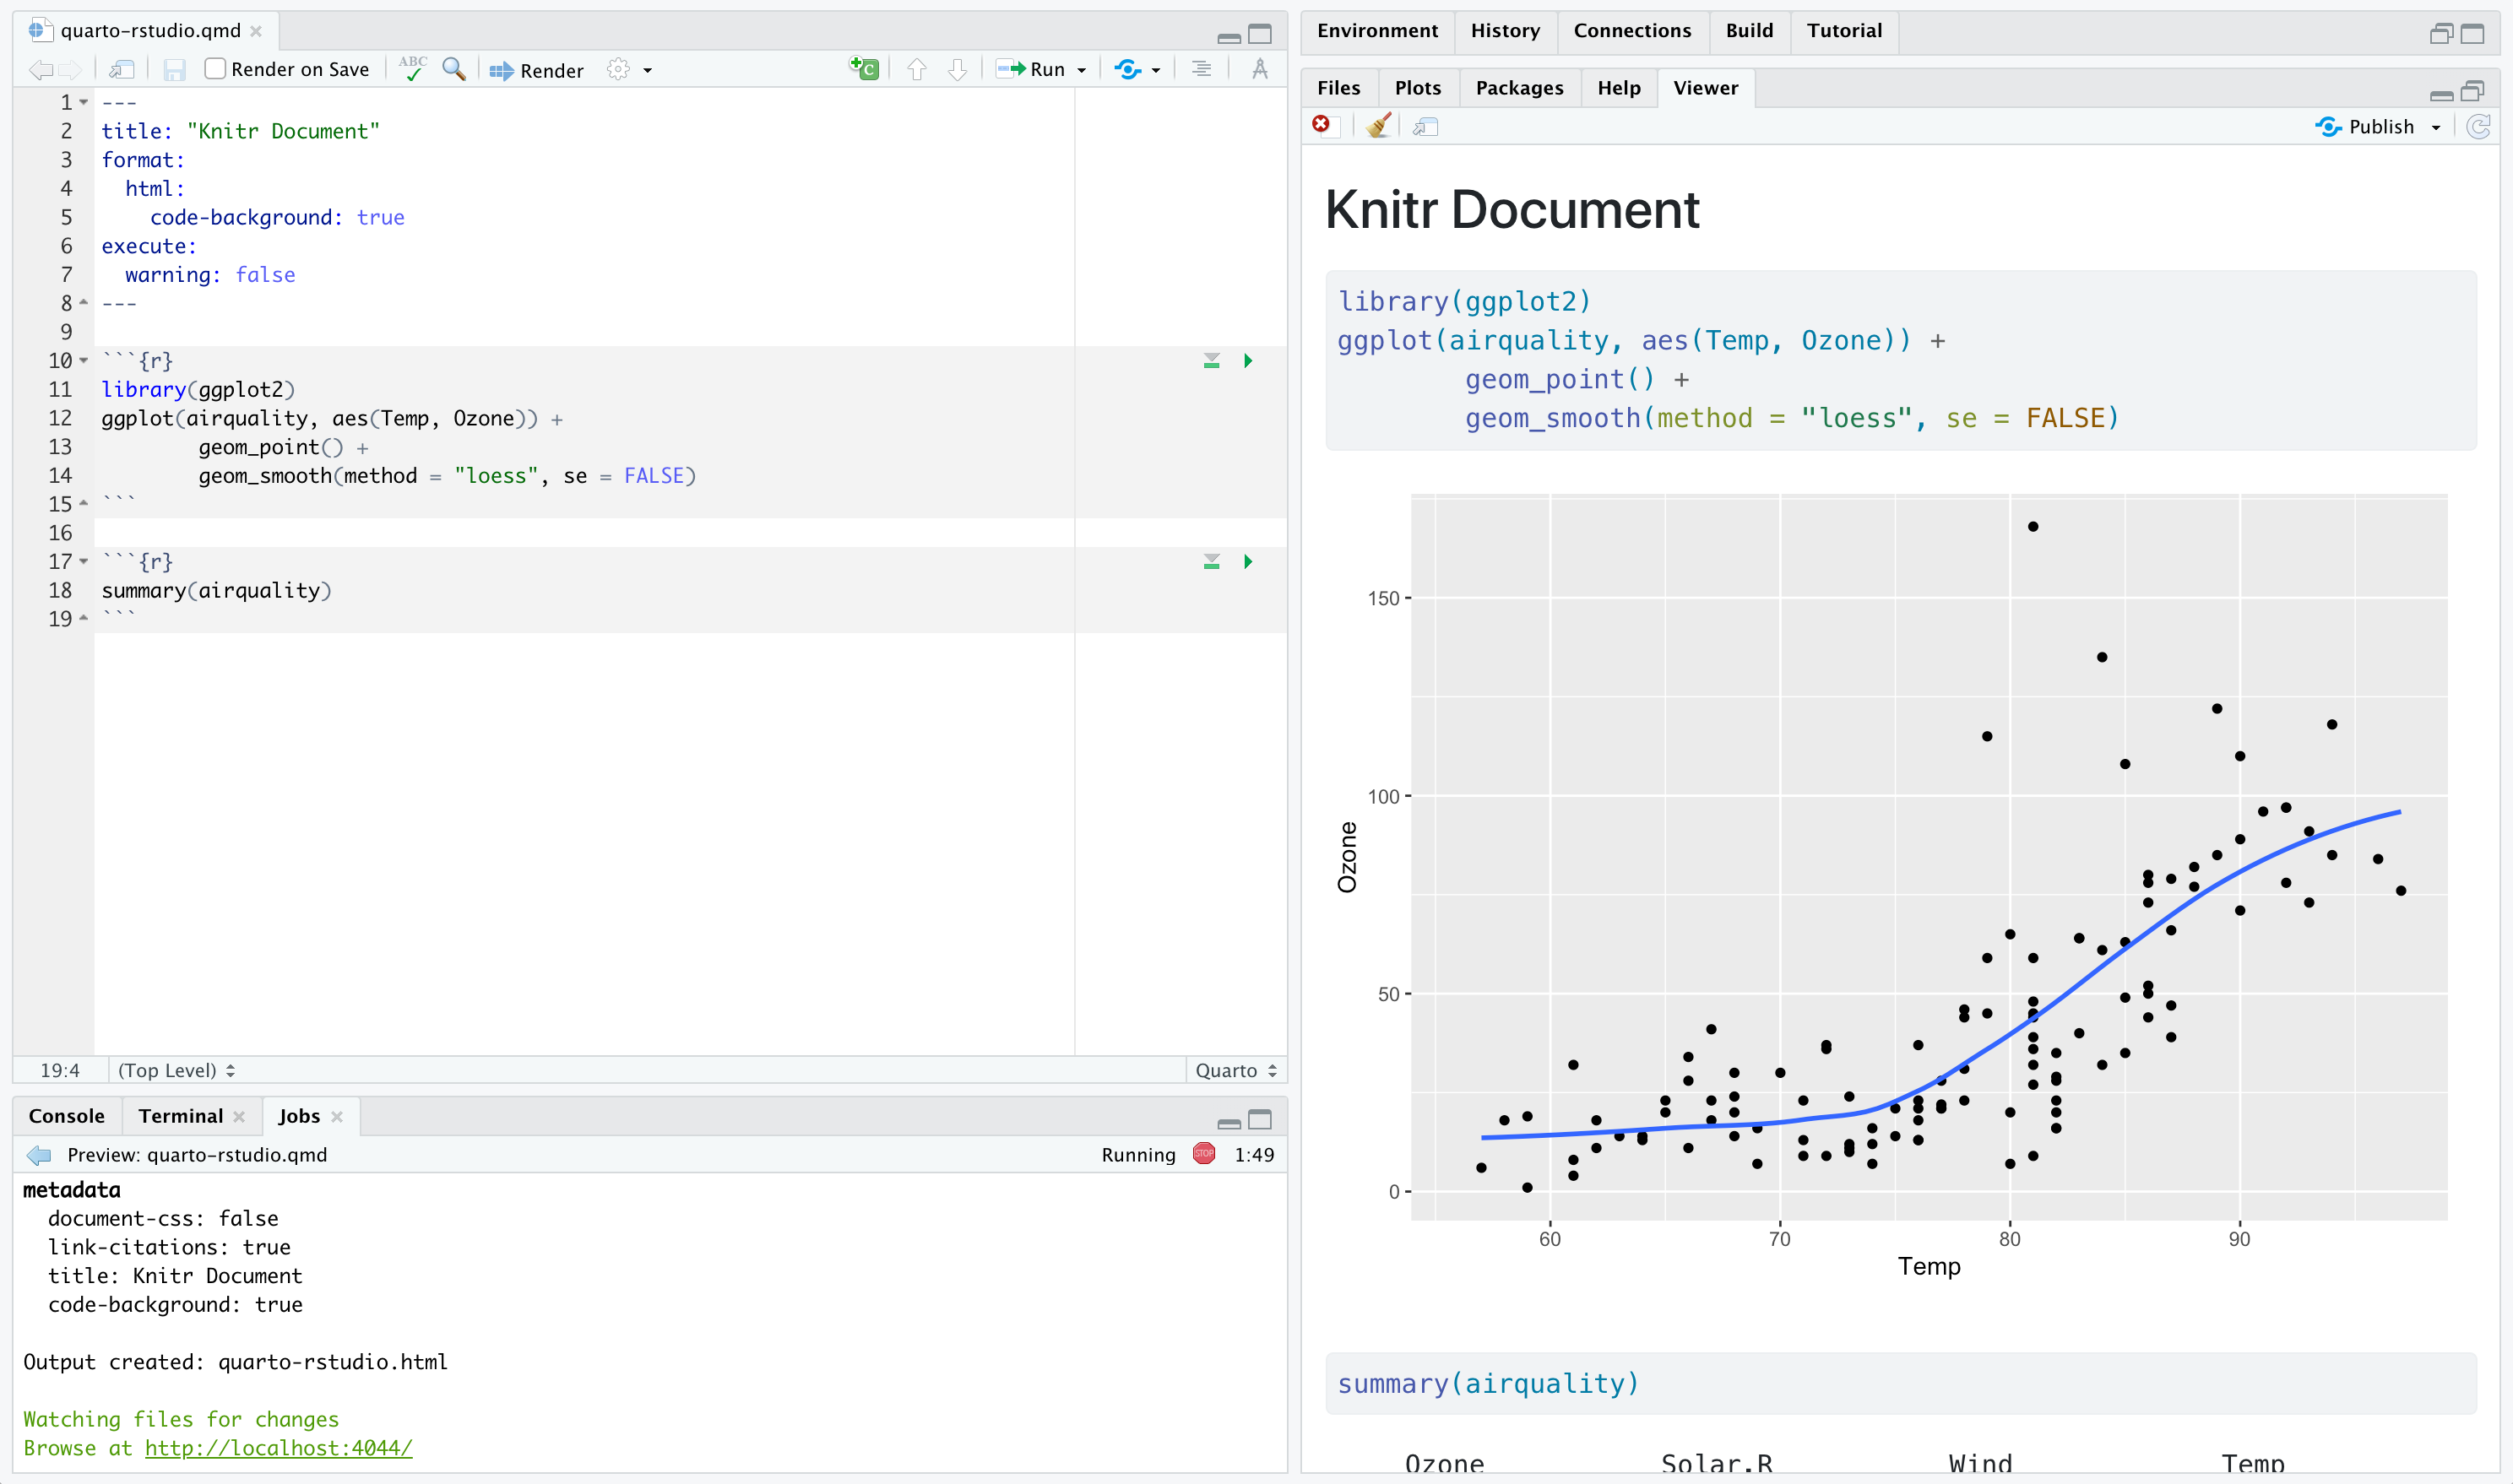
Source

Output
Change your mental model
---
title: "ggplot2 demo"
author: "Norah Jones"
date: "5/22/2021"
format:
html:
fig-width: 8
fig-height: 4
code-fold: true
---
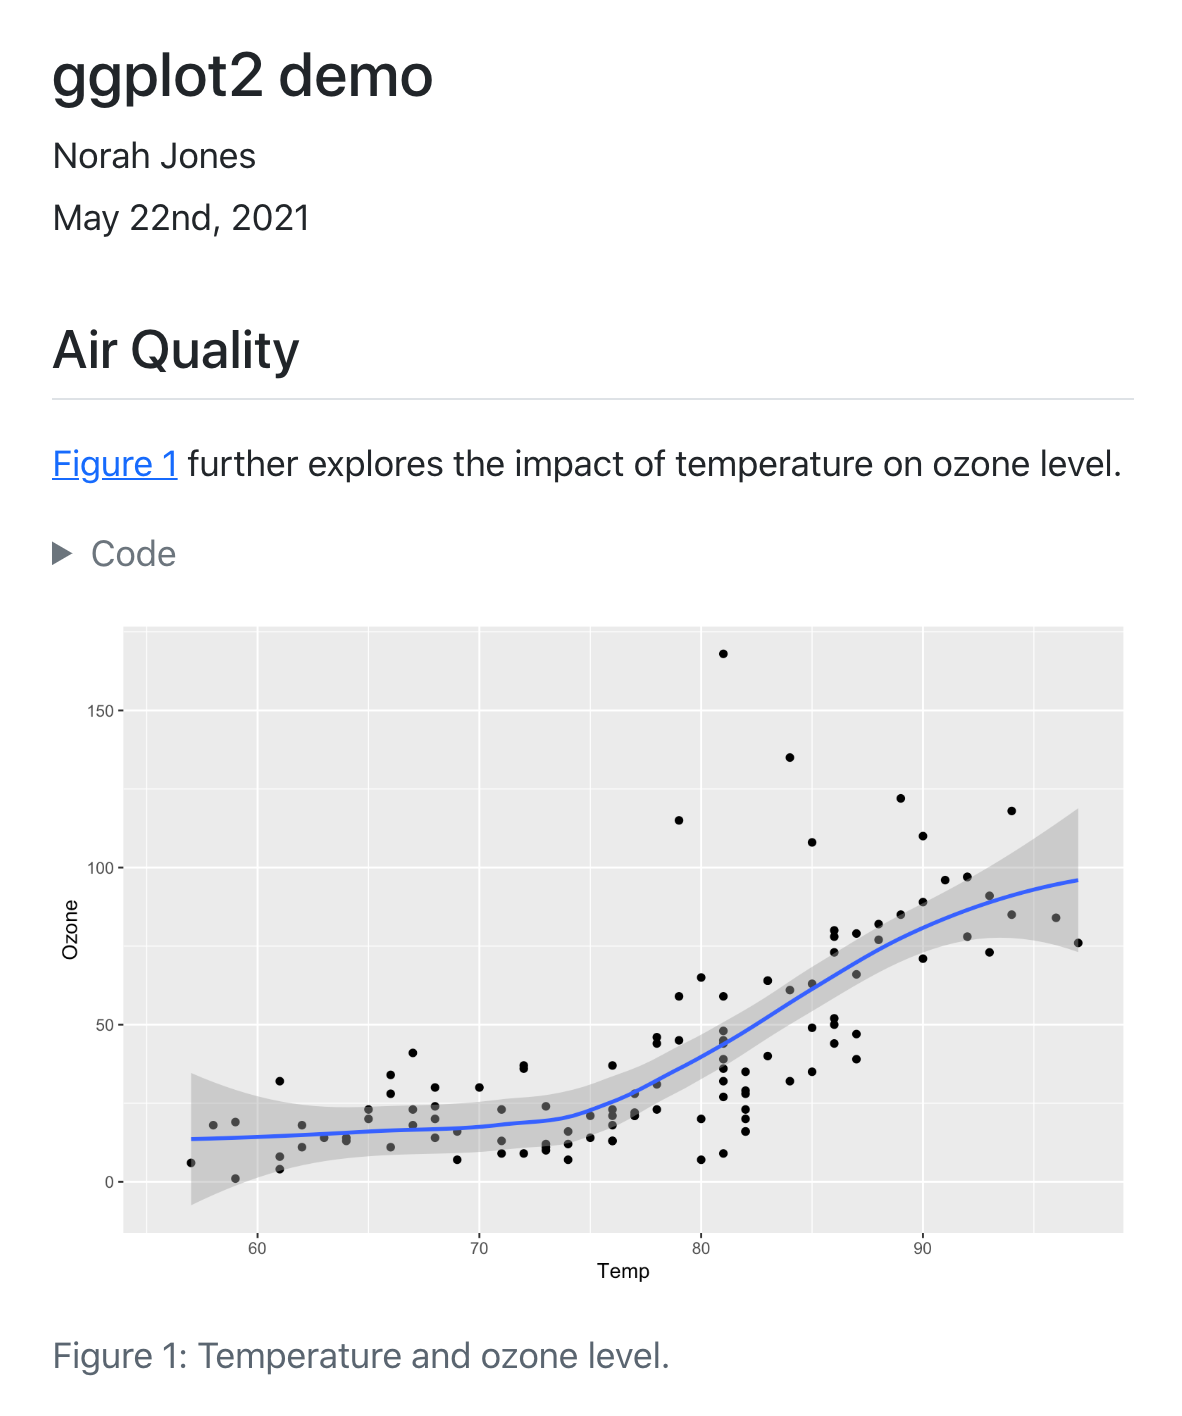
## Air Quality
@fig-airquality further explores the impact of temperature
on ozone level.
```{r}
#| label: fig-airquality
#| fig-cap: Temperature and ozone level.
#| warning: false
library(ggplot2)
ggplot(airquality, aes(Temp, Ozone)) +
geom_point() +
geom_smooth(method = "loess"
)
```
Where to use Quarto
We will be using RStudio. But this also works with Jupyter notebooks (python users), among other platforms.
So what is a Quarto doc?
A Quarto document i.e. a
.qmdis a plain text file, like a.rmd, that can be rendered to many different formats
So what is a Quarto doc?

Code chunks

Code chunk options
 Source: Code chunks
Code chunk example

Markup text
Now that we have a report with a header and some code, we need to explain what the code is doing and why.
This is where the plain text comes in.
Outside of a code chunk, type anything you want. You can even include pictures and tables.
We can also Cross Reference.

Markup text

Inline code
Inside your text you can include executable code with the syntax:
For example:
There are 344 rows in the penguins data set.

Rendering file
Save your report and…

Rendering file
Look at your console while it renders:

![]()